2023 Investment Reflections
As we start a new year, many of us are in the midst of reflecting on the past year while envisioning what the new year has to bring. And I know your investment accounts are not immune to this reflection either.
While I may be preaching to the choir here, I do like to take lessons of the “bigger picture” while a lot of financial commentary is focused on performance of 12 month cut offs.
2023 ended up with better than expected returns. Woo-hoo!!
Below is a summary of 2023 returns:
.

.
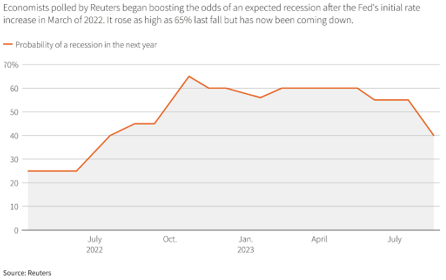
And this is the result after many economists were calling for a recession in 2023:
.

.
While this resilient market is leading to more and more headlines of a “smooth landing” and recession avoidance, let’s not forget the lesson we just learned – headlines and economists can be wrong!
Not to be too negative. A resilient economy and market is certainly something to be excited about. But managing emotions and expectations is a very important aspect of investing. So while I’m here to remind you of market resiliency after a down year, I’m here to make sure we’re not forgetting about risks after an unexpected up year as well.
A quick “emotion check” on your market experience is just to look at the last 2 years of market performance. The US stock market (S&P 500 – IVV) has been up 3.38% (1.68% annualized) and the all cap world index (ACWI) has been down -0.17% percent (-0.09% annualized). Breaking performance into calendar years though, we had one down year followed by an up year, which can make the emotional ride much different than the relatively flat 2-year result.
.

.
01/01/2022-12/31/2023 “total return” performance of IVV & ACWI (VAL = % return over total time period; ANN = Annualized % return over time period)
.
If you were emotionally impacted by the down and then up swing in the market, you’re not alone. This up-year wasn’t predicted by many and your account balance is important! I get it.
But this is a good reminder of the contrast that a short vs. long term focus can bring to your experience as an investor. And this is a good reminder to be sure that your portfolio is in line with your emotional tolerance and expecations. Not only will this make your life less stressful but this also helps ensure rash investement decisions aren’t being made, driven by emotion.
These are a couple of great lessons from a quick 2-year review, but there are other lessons that are worth highlighting as well.
Stay Invested
Markets can go up when everyone expects them to go down.
To ensure that you participate in market growth, stay invested. Growth can happen when it’s least expected.
The reassurance you have for staying invested through uncertain times is that over time, markets are up more than they are down.
Long-Term Focus
Extending beyond just a 2-year time horizon, I have one of my favorite charts below illustrating how investment performance normalizes over longer time periods:
.

.
You can see how wide the variance is on a 1-year timeline, no matter your asset class. And as time goes on, the variance becomes narrower and narrower.
.
Diversification Works
Beyond the impact of time, you can see that the 60/40 portfolio in the chart above is in full positive territory quicker than a pure stock or pure bond portfolio.
Diversification is powerful, but as the saying goes, “the best and worst thing about diversification is…it works.”
We all like diversification when markets are down. But when markets are up, you may feel like you’re missing out. This is especially relevant after a year like 2023 when the S&P 500 (as a very common benchmark) was a top performer. Just as a diversified portfolio won’t be the bottom performing asset class, it also won’t be the top performer.
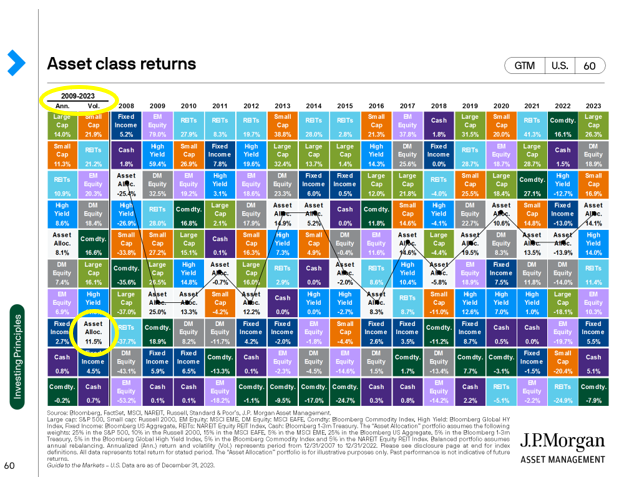
See below for another one of my favorite charts illustrating the variability of asset class performance over time and a diversified portfolio.

.
You can see that the diversified “asset allocation” portfolio (grey box) stays in the middle of the pack, smoothing out your ride.
Also important to note are the longer-term (2008-2023) return and volatility ranks (circled in yellow). You can see that the diversified portfolio has a relatively lower volatility. The return (left column) ranks relatively higher compared to the volatility rank (right column) for a diversificed portfolio. This provides a greater “risk-adjusted return” for a diversified portfolio than many other asset classes.
.
Keep Risks in Mind
Just as markets can go up when everyone expects them to go down, the same is true on the flip side.
When there are more headlines about a “smooth landing” and people are becoming excited about market growth, it’s important to keep your expectations and portfolio balanced.
There are always risks with investing.
The effect of interest rate hikes has a lag on the economy. We may not fully see the slowdown of the steepest rate hikes we’ve had in recent history until 2024 or even 2025.
A lot of sectors have high valuations, adding sensitivity to a correction if earnings come up short. And even if earnings are met, elevated valuations reduce future growth prospects as prices are already elevated. There is less room for price appreciation for these sectors.
There is an election coming up, which could create some political games impacting the market. And there are unknowns that we don’t see until it’s too late (as we experienced with several bank failures in 2023).
These items aren’t meant to scare but it’s important to balance everything together. There is power in staying invested for growth, but there is power in diversification to manage risks. Growth, corrections, volatility, and un-expected things are all part of investing.
A long-term diversified approach though is a great strategy to weather the storm while still allowing for growth.
.
Disclosures:
Commentary is provided only for informational purposes and should not be taken as investment advice. Commentary is general and investment advice should be unique to each individual. Please consult with a trusted advisor to receive advice specific to you.
Past performance is not a guarantee of future results. Indices are not available for direct investment. Their performance does not reflect the expenses associated with the management of an actual portfolio. Investment products are not FDIC Insured and may lose value.
Impact Financial, LLC (“Impact Financial”) is a registered investment advisor. Advisory services are only offered to clients or prospective clients where Impact Financial and its representatives are properly licensed or exempt from licensure.
Y Chart Source Data is based off of the following indices:
Asset Class:
US Stock – Russell 3000 Total Return, Global Stock Ex US – MSCI ACWI Ex USA Net Total Return, US Bond – Bloomberg US Aggregate, Global Bond – Bloomberg Global Aggregate, US Real Estate – Dow Jones US Real Estate Index Total Return
Regions:
US Stock – Russell 3000 Total Return, Global Stock Ex US – MSCI Ex USA Net Total Return, Emerging Markets – MSCI Emerging Markets Net Total Return, Europe Stock – MSCI Europe Net Total Return, Asia Pacific Stock – MSCI AC Asia Pacific Net Total Return, Latin America Stock – MSCI Emerging Markets Latin America Net Total Return
Equity Styles:
Large Growth – CRSP US Large Cap Growth Index Total Return. Large Blend – CRSP US Large Cap Index Total Return, Large Value – CRSP US Large Cap Value Index Total Return, Mid Growth – CRSP US Mid Cap Growth Index Total Return, Mid Blend – CRSP US Mid Cap Index Total Return, Mid Value – CRSP US Mid Cap Value Index Total Return, Small Growth – CRSP US Small Cap Growth Index Total Return, Small Blend – CRSP US Small Cap Index Total Return, Small Value – CRSP US Small Cap Value Index Total Return

January 14, 2024