2025 Mid-Year Market Review
It’s been an eventful 2025. So far this year we’ve had a change in administration, tariff policies, rising global tensions and most recently the signing of a major tax Act.
Through all these headlines though, my message remains the same: the long term, diversified approach pays off through uncertainty.
This year’s performance is already reinforcing these points. The chart below shows total return performance of several indices for the first half of the year (01/01/2025-06/30/2025):
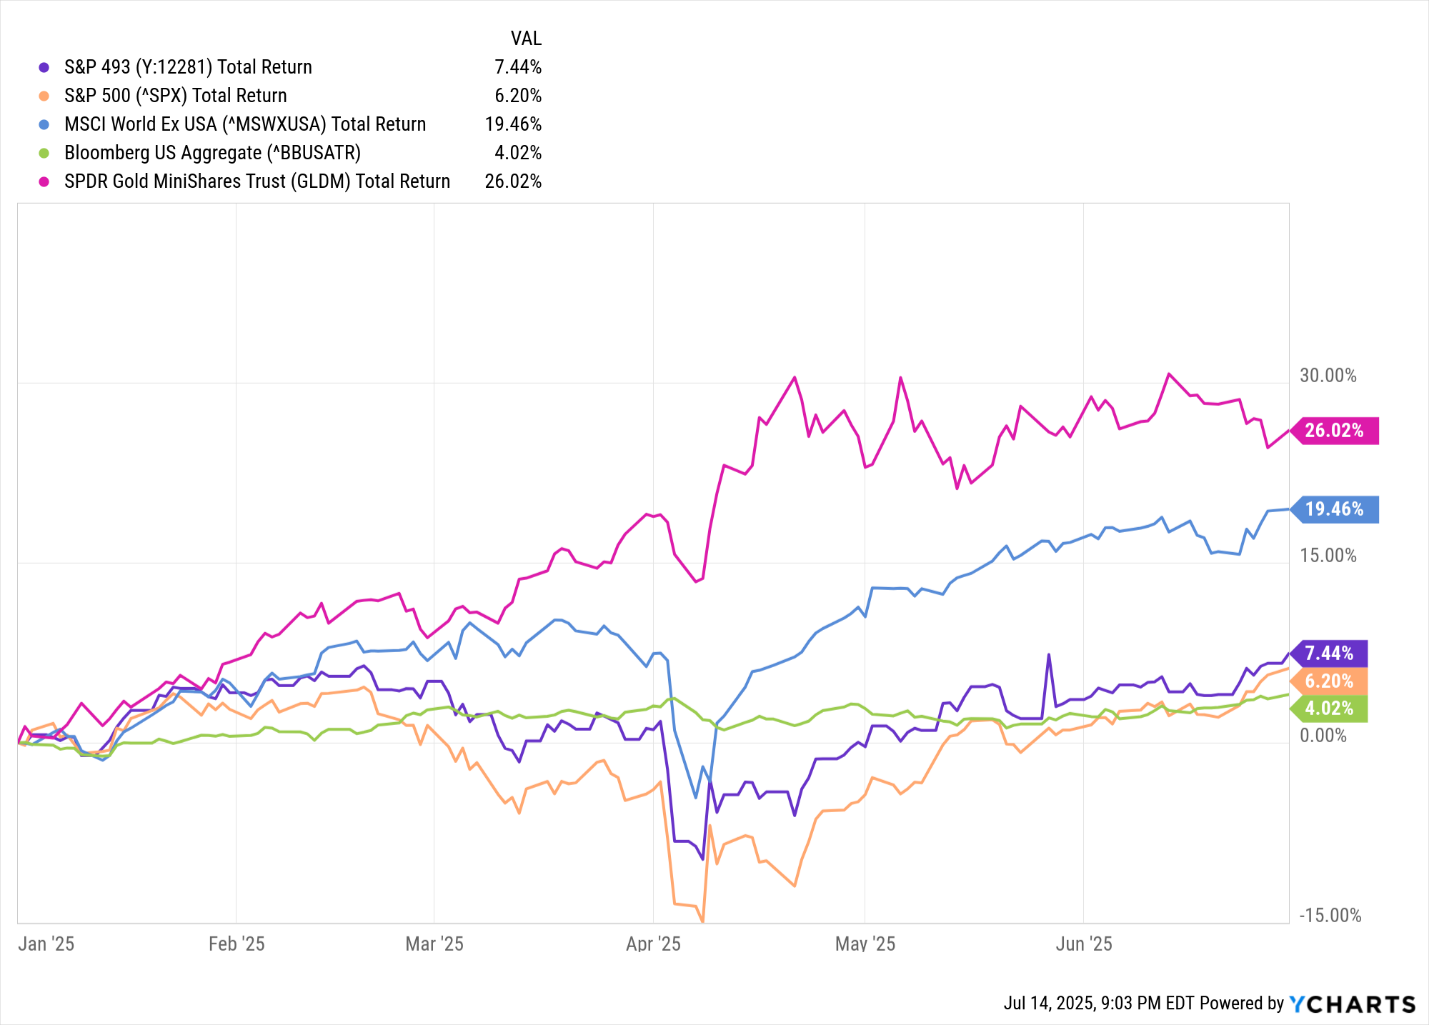
(purple line: S&P 500 ex the “Mag 7”, gold line: S&P 500, blue line: MSCI world ex US, green line: US aggregate bond index, pink line: gold (GLDM ETF used))
I chose this visual to show the dip and quick recovery that markets had when reacting to tariff potential in April.
This not only reinforces the importance of sticking with an approach through drawdowns but also illustrates how diversification provides rebalancing opportunities. Notice the stability of bonds (green) while other asset classes had larger downturns. Having a mix of assets provides opportunity to sell what’s holding up to buy what’s taken a larger dip.
For a few other highlights in the performance chart:
- The “Mag 7” (large US tech) has lagged the rest of the S&P 500.
- Gold and international equities have been leaders for the first half of the year (which ties in with the points below).
US Dollar Implications
While there have been a lot of headlines this year, the US deficit and the value of the dollar have been getting more attention recently.
These items get complicated quickly. Money supply, tax policies, interest rates, economic growth, tariffs and trade deficits all influence the value of the dollar.
Instead of diving in too deep there, I thought it might be better to start with what these dollar cycles typically look like and what their implications are for a portfolio.
Markets go through cycles, and the dollar is no different. The chart below shows the value of the U.S. dollar (DXY index) over time:
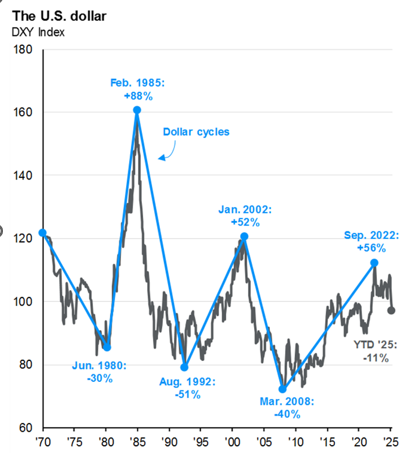
As you can see, these cycles can last several years and can have significant swings.
So far in 2025 (through 06/30/2025), the dollar has been down 11% and is already making its impact on markets.
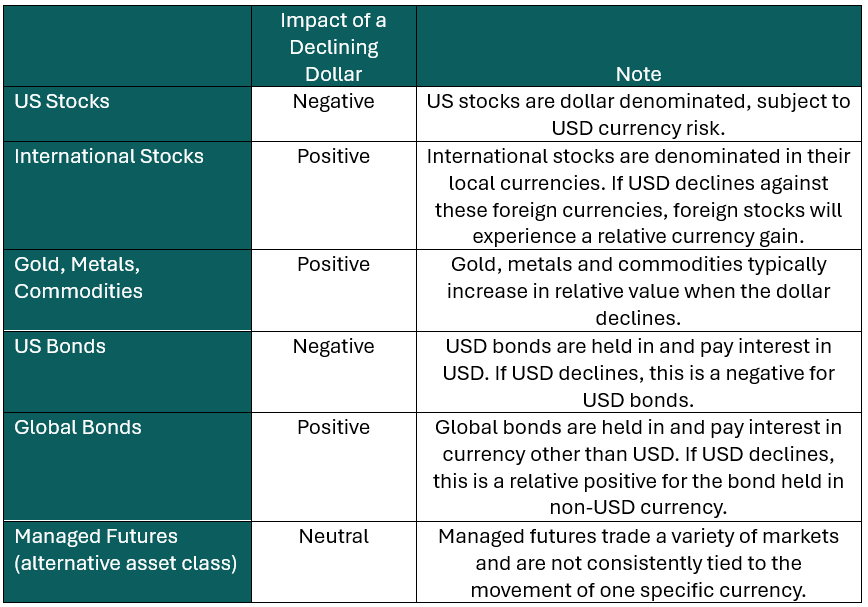
But what does this mean for your portfolio? Here’s a summary of how a declining dollar can impact a few common asset classes:
Final Thoughts
Referencing back to the performance chart, you can see that gold and international stocks have significantly outperformed US stocks and bonds year-to-date. This aligns with expectations of a declining dollar environment.
The conversation on where we go from here is always an interesting one but that conversation focuses on unknowns.
Instead, I like to focus on what we know. We know there will be changing environments like dollar swings, economic slowdowns, economic growth, interest rate changes, inflation, and more.
This stresses the importance of diversification and understanding how a portfolio will handle these varying conditions. Often investors focus their diversification efforts mixing stocks/stock funds instead of what the portfolio’s response will be to varying macro changes.
My takeway is to ensure your portfolio is considering these larger macro questions like, what’s the impact to your portfolio of a changing dollar?
Disclosures:
Commentary is provided only for informational purposes and should not be taken as investment advice. Commentary is general and investment advice should be unique to each individual. Please consult with a trusted advisor to receive advice specific to you.
Past performance is not a guarantee of future results. Indices are not available for direct investment. Their performance does not reflect the expenses associated with the management of an actual portfolio. Investment products are not FDIC Insured and may lose value.
Impact Financial, LLC (“Impact Financial”) is a registered investment advisor. Advisory services are only offered to clients or prospective clients where Impact Financial and its representatives are properly licensed or exempt from licensure.
Y Chart Source Data is based off of the following indices:
Asset Class:
S&P 500, MSCI world ex US, US aggregate bond index, GLDM ETF used a gold proxy, S&P 500 ex “Mag 7” – S&P 500 index excluding the following stocks (MFST, TSLA, AMZN, NVDA, META, AAPL, GOOG).
The U.S. Dollar Index (DXY) is a widely recognized measure of the value of the U.S. dollar relative to a basket of six major foreign currencies: the euro, Japanese yen, British pound, Canadian dollar, Swedish krona, and Swiss franc.
DXY valuation/cycle chart source: Bloomberg, FactSet, J.P. Morgan Asset Management; (Left) ICE; (Top right) BEA; (Bottom right) BIS. Currencies in the DXY Index are: British pound, Canadian dollar, euro, Japanese yen, Swedish krona and Swiss franc. *Interest rate differential is the difference between the 10-year U.S. Treasury yield and a basket of the 10-year yields of each major trading partner (Australia, Canada, eurozone, Japan, Sweden, Switzerland and UK). Weights in the basket are calculated using the 10-year average of total government bonds outstanding in each region.
Guide to the Markets – U.S. Data are as of June 30, 2025.